🎄How to add interactions to SVG🌟
If you are using mermaidJS or graphviz to generate SVG diagrams, you might want to customize them or add interactions to them.
What you might want to do:
- Add a tooltip to a node
- Add a link to a node
- Highlight on selection or hover
- Animate a node on selection
- updating styles like colors
How to customize SVG?
Let's start with Basics. SVG is just a markup language like HTML.
- So you can use CSS to style it.
- You can also use JavaScript to add interactions to it.
- Or you just edit it directly.
Given that browser just renders it, it will immediately be reflected in UI.
Let's start with some examples:
Generating simplest SVG
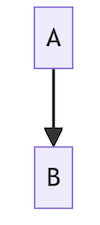
Let's start with generating a simple SVG using mermaidJS.
graph TD;
    A-->B;
which looks like this:

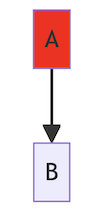
Changing color on hover (move mouse over)
Given that SVG is just a markup language, you can standard JS document.querySelector* method to select nodes.
in case of mermaidJs, it generates a SVG with g.node elements for each node, and then internal shape for actual node (e.g rect).
So you can select them and add a mouseover event listener to them.
const nodes = document.querySelectorAll('g.node');
nodes.forEach(node => {
    node.addEventListener('mouseover', () => {
        node.childNodes[0].style.fill = 'red';
    });
    node.addEventListener('mouseout', () => {
        node.childNodes[0].style.fill = '#ECECFF';
    });
});
Better solution would be to just customize that using CSS
g.node:hover rect {
    fill: red;
}

but we wanted to demonstrate that SVG is just like HTML, easy to modify on the fly.
We'll publish soon a full length post about interactivity on SVG generated by graphviz or mermaidjs.
but that's it for Advent.
